Grading a stack of tests by hand eats up time you don’t have. This Easy Grader calculator does the math for you. Enter the total number of questions and how many were wrong. Then, you get the score, number correct, percentage, letter grade, pass/fail status, and full grade chart right away.
Leave the wrong answers box empty to see a full grading chart with every possible score. Use Custom Settings to switch grading scales, set your own passing grade, and enable half points or decimals. Use keyboard shortcuts to grade fast. There are no formulas, no sign-up, and no app to download.
Easy Grader – Free EZ Grading Calculator with Full Chart
How many questions on the test?
Leave blank to see full chart
This page covers how the grading calculator works, the formula behind every grade, and all three grading scales with charts. You’ll also find quick answers for common questions and grade conversions.
What Is an EZ Grader?
An Easy Grader is also known as EZ Grader. It converts the total number of questions and the wrong answers into a percentage and a letter grade, without any math.
Before online tools, teachers used a small cardboard slide chart. They lined up the total number of questions on one wheel, and the wrong answers on the other, and the score appeared through a small window cut into the chart.
What This Online EZ Grader Does for You
You type in two numbers. You get five things back right away: percentage, correct count, letter grade, pass/fail status, and a full printable grading chart. It works on a phone as well as on a desktop. No formula to remember. No extra app. No waiting.
This helps most when you’re grading a stack of thirty papers at once. You don’t do the same math thirty times. Set up the test once, then read each grade from the chart.
How Does The EZ Grader Calculator Work
Enter the total number of questions for any exam, test, or quiz. Then enter how many the student got wrong. The tool subtracts one from the other to get the correct number of answers. It then turns that number into a percentage.
That percentage gets matched to your grading scale, whether it’s the standard A through F scale, the plus-minus scale, or a simple pass-fail cutoff. Your browser does the work, so the result appears instantly with no page reload.
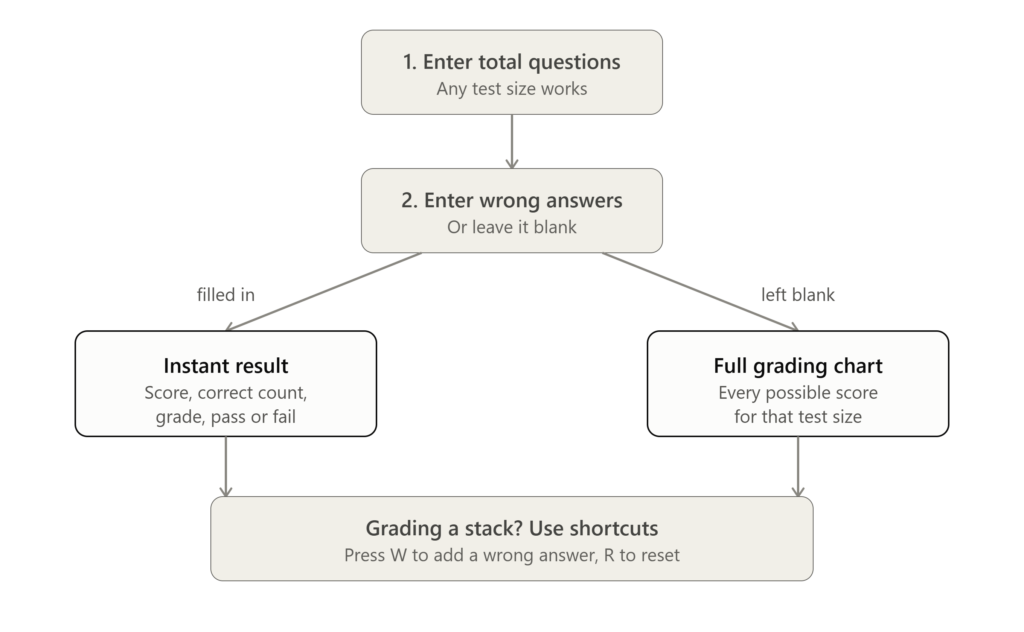
Want to skip the wrong-answer field? Leave it blank instead. You’ll get the full chart with every possible outcome for that test size, all at once.
Step-by-Step Guide To Use It
Your percentage, correct count, and pass or fail status update as you type. Use this overall grade calculator by following these simple steps:
1. Enter Total Questions
Start with the total number of questions on the test, quiz, or assignment. You can enter any number up to 500. So, it works for either a short quiz or a long final.
2. Enter Wrong Answers (Optional)
Next, add the number of wrong answers. Your score shows up right away. Don’t have that number yet? Leave it blank. You’ll see every possible score in a full grading chart.
3. Use the Quick Shortcuts
Grading a stack of papers goes faster with keyboard shortcuts. Press W to add one wrong answer at a time. Press R to reset the number of wrong answers before moving to the next student. No need to click the mouse.
4. Adjust Custom Settings
Your school’s grading rules might not match the default. So, open Custom Settings to change your passing grade. You can also switch grading scales, turn on decimals, or enable half-points.
Formula Behind This Tool
The formulas behind this grading calculator are:
Correct Answers = Total Questions − Wrong Answers
Percentage = (Correct Answers ÷ Total Questions) × 100
Example: A test has 40 questions. A student gets 6 wrong.
Solution: By using the above formulas, we get;
Correct Answers = 40 – 6 = 34
Percentage = (34 ÷ 40) × 100 = 85%.
Letter Grade = B, since B = 83-86% on the standard scale.
The calculator runs this quickly for any combination of numbers you enter. So, you don’t need to divide or round anything by hand.
Save Your Easy Grader Chart PDF or Print It
Once your Grading Chart is built, click the Print Chart button. On both desktop and mobile, this opens a print screen with a Save as PDF option, so you can keep a digital copy or print a paper version for your desk. No extra app needed; it works straight from your browser.
3 Grading Scales: Plus-Minus, Standard, or Pass/Fail
One grading scale doesn’t fit every classroom, so pick the one that matches your school:
- A+ / A / A− (Plus-Minus Scale): The full plus-minus breakdown many high schools and colleges use.
- A / B / C / D / F (Standard Scale): The straightforward five-letter scale used across most of the US.
- Pass / Fail: A simple pass-or-fail result based on your passing threshold, useful for mastery-based grading or pass/fail courses.
You can also set your own passing grade percentage in Custom Settings. If your school uses 70% instead of 60%, change it once, and every result matches your school’s actual policy.
1. Plus-Minus Grading Scale
| Percentage | Letter Grade |
|---|---|
| 97–100% | A+ |
| 93–96% | A |
| 90–92% | A− |
| 87–89% | B+ |
| 83–86% | B |
| 80–82% | B− |
| 77–79% | C+ |
| 73–76% | C |
| 70–72% | C− |
| 60–69% | D |
| Below 60% | F |
Note: These percentage ranges are continuous. For example, 83–86% covers every score up to 86.99%, and 87% or higher moves into the next grade. There’s no gap between ranges.
2. Standard Grading Scale
| Percentage | Letter Grade |
|---|---|
| 90–100% | A |
| 80–89% | B |
| 70–79% | C |
| 60–69% | D |
| Below 60% | F |
Both tables update automatically based on the scale you pick in Custom Settings. You don’t need to memorize either one; the calculator matches your percentage to the right letter the moment you enter your numbers.
Half Points and Decimals
Custom Settings gives you two options for scores: Half-Points and Show Decimals. Turn on either one or both, depending on how your test is graded.
- Half-Points handles partial credit, like 0.5 points on a short answer. Turn it on when your grading allows a half point, and the calculator counts it correctly instead of forcing it into a whole number.
- Show Decimals gives you the exact percentage instead of a rounded one. This is most useful on short tests, where rounding can change the final grade more than it would on a longer one.
Key Benefits for Teachers
Here’s what makes this ez grader worth using over a paper chart or manual math:
1. Speed
One chart covers your entire class. Instead of calculating each student’s score by hand. You look up their result once the chart is built.
2. Accuracy
Every percentage is calculated using the same formula. No chance of misreading a number, no rounding mistake, no arithmetic slip on a tired Friday afternoon.
3. Flexibility
Not every school grades the same way. That’s why the tool’s Custom Settings allow you to set things up yourself. Pick your grading scale. Set your own passing grade. Turn on half-points or decimals. The result fits your classroom, not a generic default.
4. Privacy
Nothing you type gets uploaded or stored anywhere. The calculation happens right in your browser, so it’s safe to use with real student data.
5. No cost, no setup
It’s free with no account creation or download requirement. It works the same on a phone in the hallway as it does on a classroom computer.
Who Uses This Free Grading Tool
- Teachers use it to grade multiple-choice tests, quizzes, and worksheets without doing the math by hand. Many of them keep a printed chart on the desk while marking a stack of papers.
- Students use it after a practice test or quiz. It helps them to check their own score before the official results announcement.
- Tutors also use it. When a student finishes a practice test, the tutor types the numbers into this ez grader and gets the score right away. So, they save time for actual instruction.
- Parents find it useful as well. They want to know what the score means. This grader tool turns the score into a letter grade, so parents know exactly how well their child did.
Easy Grader vs Manual Grading
| Features | Online Easy Grading | Manual Grading |
|---|---|---|
| Speed | Instant, whole chart at once | Minutes per test |
| Accuracy | Exact, no rounding errors | Risk of arithmetic mistakes |
| Reusability | One chart covers the whole class | Recalculate for every student |
| Cost | Free | Free, but time-costly |
| Device | Any browser | Calculator or paper wheel |
The paper slide chart could only show one grade at a time and usually stopped around 50 questions. This ez-grader has no such limit, works entirely in your browser, and costs nothing to use.
How Many Questions Can You Miss?
Quick Rule: Divide the total questions by 10, and that’s roughly how many you can miss for an A. Divide by 5, and that’s roughly how many you can miss for a B.
Example: On a 50-question test, 50 ÷ 10 = 5. Miss 5 or fewer, and you’re likely still in the A range. 50 ÷ 5 = 10. Miss up to 10, and you’re likely still in the B range.
This is a quick estimate, not an exact cutoff, since grading scales vary. For the exact number on your test, enter your total number of questions above and check the Grading Chart.
Max Wrong Answers by Test Size
|
Test Size |
Pass (60%) |
B (80%) |
A (90%) |
|---|---|---|---|
|
10 questions |
4 wrong |
2 wrong |
1 wrong |
|
15 questions |
6 wrong |
3 wrong |
1 wrong |
|
20 questions |
8 wrong |
4 wrong |
2 wrong |
|
25 questions |
10 wrong |
5 wrong |
2 wrong |
|
30 questions |
12 wrong |
6 wrong |
3 wrong |
|
40 questions |
16 wrong |
8 wrong |
4 wrong |
|
50 questions |
20 wrong |
10 wrong |
5 wrong |
|
100 questions |
40 wrong |
20 wrong |
10 wrong |
These numbers use the default 60% passing threshold. If your school uses a different cutoff, change the passing grade in Custom Settings and use the Grading Chart for your exact test size to see the real numbers.
Common Grade Conversions
| Score | Percentage | Standard Grade | Plus-Minus Grade |
|---|---|---|---|
| 6/10 | 60% | D | D |
| 7/10 | 70% | C | C− |
| 8/10 | 80% | B | B− |
| 9/12 | 75% | C | C |
| 10/12 | 83.3% | B | B |
| 10/15 | 66.7% | D | D |
| 11/15 | 73.3% | C | C |
| 12/15 | 80% | B | B− |
| 13/15 | 86.7% | B | B |
| 14/15 | 93.3% | A | A |
| 15/18 | 83.3% | B | B |
| 15/20 | 75% | C | C |
| 16/20 | 80% | B | B− |
| 18/20 | 90% | A | A− |
| 17/25 | 68% | D | D |
| 18/25 | 72% | C | C− |
| 19/25 | 76% | C | C |
| 20/30 | 66.7% | D | D |
| 23/30 | 76.7% | C | C |
| 24/30 | 80% | B | B− |
| 25/30 | 83.3% | B | B |
| 26/30 | 86.7% | B | B |
| 33/40 | 82.5% | B | B− |
| 35/40 | 87.5% | B | B+ |
| 36/40 | 90% | A | A− |
| 37/40 | 92.5% | A | A− |
| 30/50 | 60% | D | D |
| 36/50 | 72% | C | C− |
| 40/50 | 80% | B | B− |
| 42/50 | 84% | B | B |
| 45/50 | 90% | A | A− |
Enter your own total questions and wrong answers above to see this same breakdown for any test size, not just the ones listed here.
Common Grading Mistakes to Avoid
- Entering the wrong total question count. Every result depends on this number. Double-check it before grading a full stack.
- Miscounting blank or skipped answers. Most grading policies treat a skipped question the same as a wrong one. Decide this before you start marking, not partway through.
- Mixing grading scales mid-class. Switching between the standard scale and the plus-minus scale partway through a stack of papers produces inconsistent grades. Set the scale once before you begin.
- Forgetting partial credit. If your test allows half-points, turn on Half-Points before entering scores, or the final percentage will be off.
Conclusion
This online EZ grader turns any test score into a percentage, letter grade, and full grading chart in seconds, no math, no account, and no download required. Whether you’re grading one quiz or a full stack of thirty, the same two numbers, total questions and wrong answers, give you every result you need instantly.
Try it on your next test. Enter your total questions, add the wrong answers, and see your grade appear the moment you type. For any questions regarding this tool, you can contact us.